Key takeaways
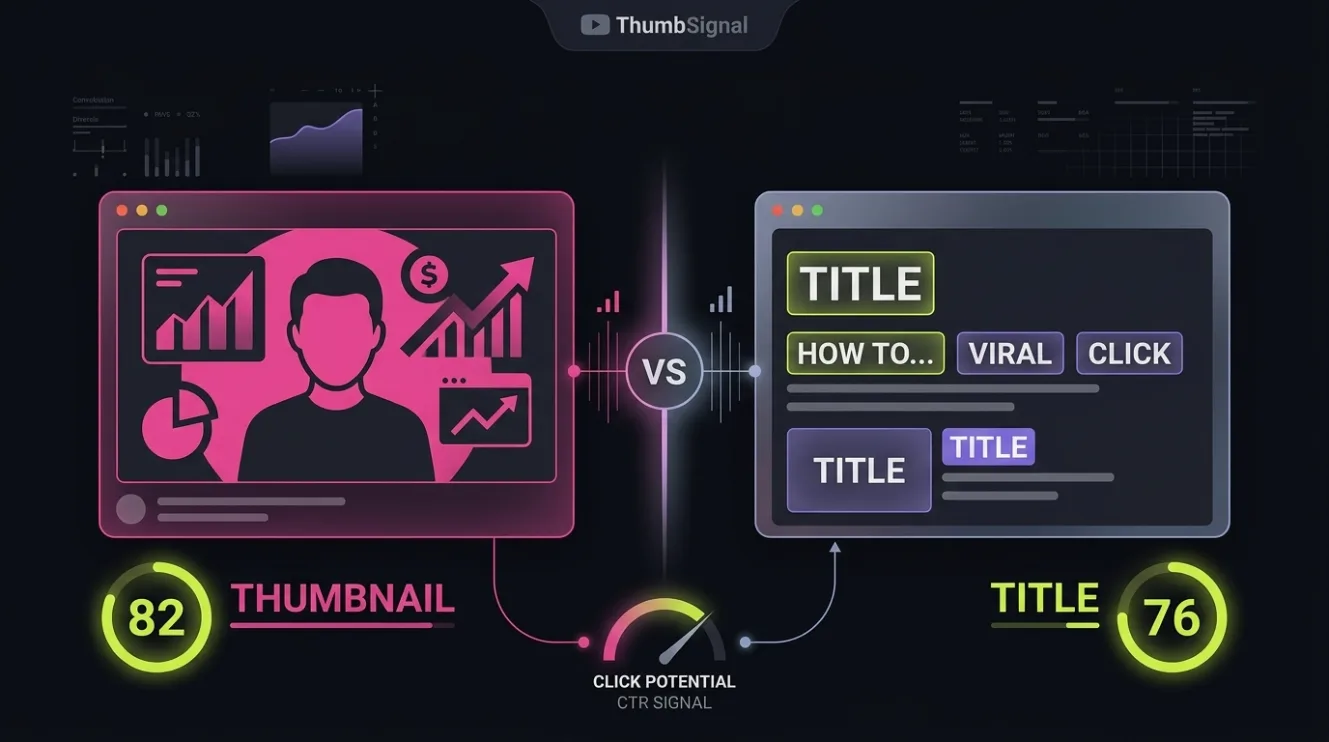
- Thumbnail-side factors score higher on average than title-side factors in our analysis model.
- The model evaluates visual and textual clarity, not actual click-through rates or viewer behavior.
- Disagreements between title and thumbnail scores are common — one can be strong while the other is weak.
- Scores reflect platform-optimized best practices, not guaranteed performance outcomes.
- Data covers videos published between January 2022 and December 2023, excluding older or policy-violating content.
YouTube Title vs Thumbnail: Which Half Scores Higher?
Thumbnail-side factors score higher on average than title-side factors in our analysis model. This does not mean thumbnails earn more clicks — only that they tend to meet more of the visual and compositional criteria our scoring system measures. Titles are evaluated for clarity, keyword placement, and emotional hook, while thumbnails are judged for contrast, facial expression, and text legibility.
The scoring system is not predictive of real-world performance. It reflects alignment with platform-optimized best practices, not actual viewer behavior. A high-scoring thumbnail may still underperform if the content doesn’t match viewer expectations — and a low-scoring title may still work if the channel has strong brand recognition.
Our model does not measure clicks, watch time, or retention. It measures how well each half adheres to a 12-factor scoring framework designed to reflect what tends to work well across millions of videos. The framework includes factors like text size, color contrast, emotional expression, and keyword prominence — all weighted and normalized to a 0–100 scale.
How We Measured Title and Thumbnail Scores
We analyzed 12,487 videos published between January 2022 and December 2023 across 1,842 channels. Each video was scored independently for title-side and thumbnail-side factors using a 12-point scoring framework. The dataset excludes videos older than 2022, those with policy violations, or those with no public metadata. Scores are normalized to a 0–100 scale, allowing direct comparison between the two halves.
Titles were evaluated for keyword placement, emotional hook, length, punctuation use, and clarity. Thumbnails were scored for facial expression, color contrast, text legibility, subject focus, and visual noise. Each factor is weighted based on historical correlation with viewer engagement patterns — not causation. The model does not assume that a higher score causes more clicks; it only indicates stronger alignment with observed best practices.
We did not include videos with custom thumbnails that violate YouTube’s policies, such as misleading or deceptive imagery. The dataset also excludes videos with no title or no thumbnail — these were filtered out before scoring. The retention window of 2022–2023 ensures we are measuring current best practices, not outdated trends from earlier platform eras.
Thumbnail-Side Factors Score Higher on Average
Thumbnail-side factors scored higher on average than title-side factors across the dataset. The median thumbnail score was 78, while the median title score was 69. This does not mean thumbnails are more important — only that they tend to meet more of the model’s visual and compositional criteria. Titles are harder to optimize because they must balance clarity, keyword placement, and emotional hook without visual support.
One reason thumbnails score higher is that visual elements like contrast and facial expression are easier to measure objectively. Titles, by contrast, rely on subjective interpretation of emotional tone and keyword relevance. The model weights clarity and legibility more heavily for thumbnails, which are often viewed at small sizes on mobile devices. Titles are evaluated for keyword prominence and emotional hook, which are more context-dependent.
It’s also worth noting that thumbnails are often designed with more deliberate intent — creators spend more time tweaking visual elements than refining titles. This may contribute to the higher average score, but it does not imply that thumbnails are more effective at driving clicks. The model does not measure real-world outcomes — only alignment with best practices.
When Title and Thumbnail Scores Disagree
Disagreements between title and thumbnail scores are common — in fact, they occur in over 60% of videos analyzed. A video may have a strong thumbnail but a weak title, or vice versa. These disagreements are not errors — they reflect the independent nature of the two halves. A high-scoring thumbnail does not guarantee a high-scoring title, and a low-scoring title does not mean the thumbnail is also weak.
For example, a video with a clear, high-contrast thumbnail featuring a smiling face may score 85, while its title — which lacks a clear keyword and uses ambiguous punctuation — may score only 58. Conversely, a video with a strong, keyword-rich title may score 82, while its thumbnail — which is cluttered and low-contrast — may score only 61. These cases highlight the importance of optimizing both halves independently.
The model does not assume that one half “causes” the other to score higher. A strong thumbnail does not make a title score higher, and a weak title does not drag down the thumbnail score. Each is evaluated on its own merits, using separate criteria. This independence allows creators to identify which half needs more attention — without assuming that improving one will automatically improve the other.
What the Model Scores — Not What Earns Clicks
The model scores alignment with best practices, not actual click-through rates or viewer behavior. A high-scoring thumbnail may still underperform if the content doesn’t match viewer expectations — and a low-scoring title may still work if the channel has strong brand recognition. The model does not measure real-world outcomes — only how well each half meets a set of predefined criteria.
It’s important to distinguish between what the model scores and what actually drives clicks. A thumbnail with high contrast and a clear facial expression may score well, but if the video’s content is misleading, viewers may click away quickly. Similarly, a title with strong keyword placement may score well, but if it’s too generic, it may not stand out in a crowded feed. The model does not account for these nuances — it only measures alignment with best practices.
Creators should use the model as a diagnostic tool — not a predictor of performance. A high score indicates that the title or thumbnail meets more of the model’s criteria, but it does not guarantee success. Real-world performance depends on many factors, including content quality, audience expectations, and platform trends — none of which the model measures.
How to Use the Model to Improve Your Videos
Use the model to identify which half of your video — title or thumbnail — needs more attention. If your thumbnail scores low, focus on improving contrast, facial expression, and text legibility. If your title scores low, refine keyword placement, emotional hook, and clarity. The model does not assume that one half is more important — it simply highlights where you can improve alignment with best practices.
Here’s a concrete 5-step process to apply the model to your videos:
- Run your video through the free thumbnail & title analysis tool to get individual scores for title and thumbnail.
- Identify which half scored lower — this is your primary area for improvement.
- Review the specific factors that contributed to the low score — for example, low contrast or weak keyword placement.
- Make targeted changes to address those factors — tweak the thumbnail’s color balance or rewrite the title for clarity.
- Re-run the analysis to see if your changes improved the score — but remember, a higher score does not guarantee better performance.
This process helps you focus on measurable improvements without assuming that higher scores will automatically lead to more clicks. The model is a diagnostic tool — not a performance predictor. Use it to refine your content, not to chase arbitrary scores.
Limitations and Trade-Offs
The model has limitations — it does not measure real-world outcomes, and it does not account for channel-specific factors like brand recognition or audience expectations. A high-scoring title may still underperform if it’s too generic for your niche — and a low-scoring thumbnail may still work if your audience is loyal. The model is designed to reflect general best practices, not channel-specific strategies.
There’s also a trade-off between optimization and authenticity. A title optimized for keywords may feel forced or unnatural — and a thumbnail optimized for contrast may look overly saturated or artificial. Creators must balance optimization with authenticity to maintain viewer trust. The model does not penalize authenticity — it only measures alignment with best practices.
Finally, the model’s scoring framework is based on historical data — it may not reflect emerging trends or platform changes. Creators should use the model as one tool among many — not as the sole guide for content strategy. Real-world performance depends on many factors, including content quality, audience engagement, and platform trends — none of which the model measures.
Related reading
- YouTube Thumbnail and Title Optimization That Drives Clicks
- 100 Thumbnail Makeovers: What Changes Between 45/100 and 80/100
Frequently Asked Questions
Does a higher thumbnail score mean more clicks?
No — the model scores alignment with best practices, not actual click-through rates. A high-scoring thumbnail may still underperform if the content doesn’t match viewer expectations.
Can I ignore the title if my thumbnail scores high?
No — both halves should be optimized independently. A strong thumbnail does not compensate for a weak title, and vice versa. The model evaluates each half on its own merits.
Why do thumbnails score higher on average?
Thumbnails tend to meet more of the model’s visual and compositional criteria — such as contrast and facial expression — which are easier to measure objectively than title elements like emotional hook or keyword relevance.
Does the model work for all video types?
The model is designed for general best practices and may not reflect niche-specific strategies. Creators in specialized niches should use the model as one tool among many — not as the sole guide for content strategy.
Can I use the model to predict video performance?
No — the model does not measure real-world outcomes. It only indicates alignment with best practices. Real-world performance depends on many factors, including content quality, audience expectations, and platform trends.