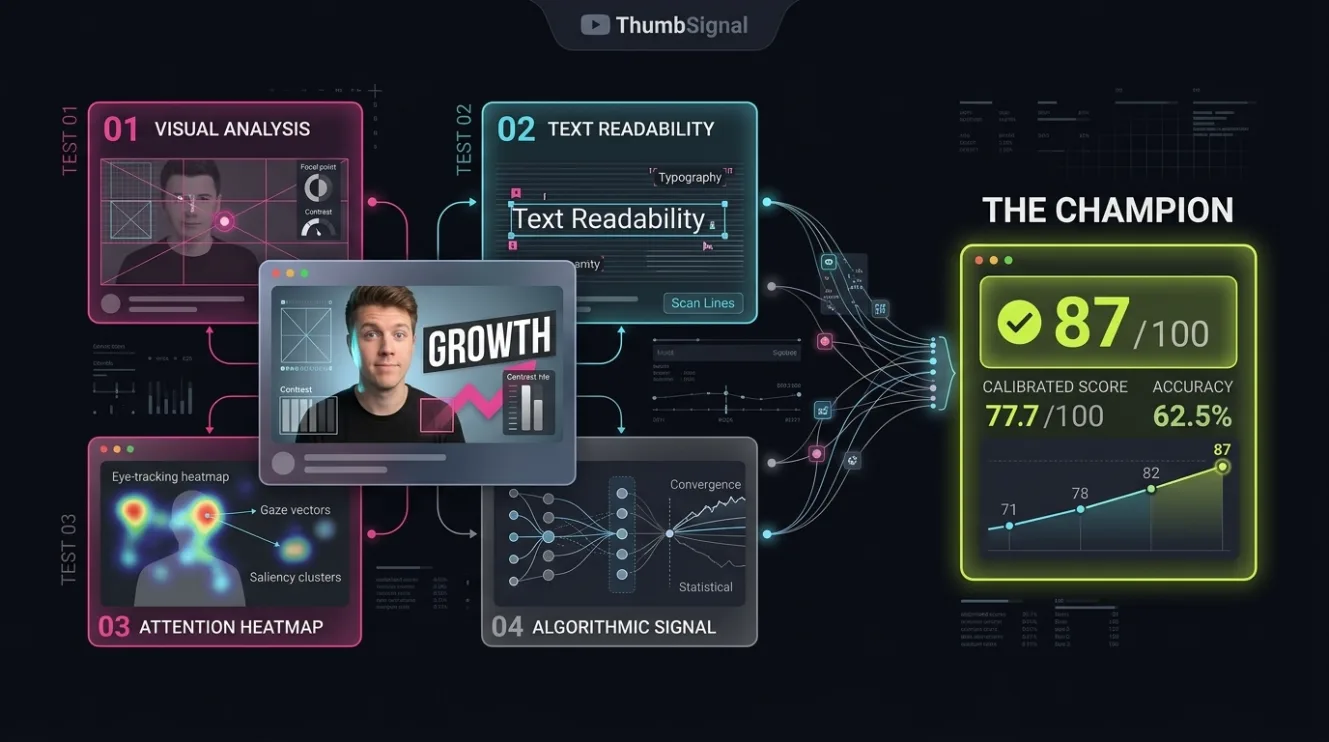
After testing our thumbnail score against 321 pairs of real videos, we tried to make it more accurate. We tried four things. One moved the number, and on inspection it was a fairer measurement rather than a better model. The other three changed nothing, or made the score harder to trust. Here is each one, with the numbers.
Key takeaways
- Comparing scores at full precision instead of as rounded whole numbers raised measured accuracy from 59.5% to 62.0%, and all of that came from 17 former ties, which broke roughly evenly.
- Rewritten scoring instructions looked like a breakthrough on 30 thumbnails and did nothing on 322: 64.6% before and 63.4% after, on 161 pairs.
- Asking the AI to compare two thumbnails head to head matched the ordinary score on average, 62.7% each, but its answer depended on which image came first.
- The model's reasoning setting changed nothing except at its highest level, and that level never returned an answer in the European region we use to keep uploads in the EU.
- The published, pre-registered result stays at 59.5%. Everything here is follow-up work and labelled as such.
Can a thumbnail score be made more accurate after it has been tested?
Not easily, in our case. Of four changes we tested against real videos, one raised the measured accuracy, from 59.5% to 62.0%, and it did so by fixing how scores were compared rather than by making the model see anything new. The other three left accuracy where it was. The score appears to be close to what this model can do.
That is a less exciting answer than a new record, and a more useful one. It says where effort should not go, and it explains why each tempting idea failed. That matters beyond this one score, because the same traps catch creators testing their own thumbnails.
The fix that worked: stop rounding before comparing
The score you see is a whole number from 0 to 100. In our original test, the two videos in a pair sometimes landed on the same whole number, and that happened 17 times in 321 pairs. Our pre-registered rules counted every tie as a failure, on the reasoning that a score which cannot separate two videos has not discriminated between them.
Behind the whole number is a precise value, and rounding throws the difference away. Comparing the precise values leaves no ties at all, and the measured accuracy rises from 59.5% to 62.0%: 199 of 321 pairs instead of 191. No video was re-scored and no weighting changed; the precise value was already there.
Why that is a fairer number, not a better model
The obvious question is which way those 17 ties broke. If the model had been quietly getting them right, rounding would have been hiding real skill. It had not. Eight of the 17 went to the better-performing video and nine did not, which is about what a coin toss would produce.
So the gain comes from no longer marking coin tosses as automatic failures, not from the model knowing more. That is why the published result stays at 59.5%: it was the figure we committed to in advance, under rules written before we saw any data. The 62.0% is reported as a follow-up measurement, clearly labelled, and it describes the same model.
Tuning the instructions: a small pilot that looked like a breakthrough
The model's ratings bunch together. Several of the twelve factors the score is built from sat in narrow bands across hundreds of real thumbnails, and our original test showed the score is most reliable when it puts two videos far apart. So we rewrote the instructions to give the scale a reference point: 50 meaning the typical video in the same feed, 90 and above reserved for the top tenth.
On a pilot of 30 thumbnails, scored under both versions, it looked like it worked. Eight of the twelve factors spread out, and two of them nearly doubled their spread. We then ran the new instructions on 322 thumbnails. The two factors that had nearly doubled grew by just 1.1 and 0.1 points of spread. On 161 pairs, the original instructions picked the better video 64.6% of the time and the new ones 63.4%, a difference well within chance. The new version also lowered almost every rating by five to seven points, so it would have cost every creator several points of score for nothing.
Why more spread did not mean more accuracy
The pilot was simply too small. With 30 thumbnails, a measure of how spread out ratings are swings a long way by chance, and two factors doubling was inside that swing. The pilot should have been read as a reason to run a bigger test, not as a result.
The larger run held a second lesson. Two factors, curiosity and clickbait risk, genuinely did spread out across 322 thumbnails, and the ranking still did not improve. Wider ratings only help if the extra width follows real differences between videos. Here it followed noise, and noise that looks like confidence is worse than none.
Comparing thumbnails head to head instead of scoring them
Scoring each thumbnail on its own and then comparing the numbers is not how people choose between thumbnails; they look at two side by side. So we asked the model to do that: shown both videos from a pair, which one outperformed? Each of the 161 pairs was shown twice, once in each order.
Averaged over both orders, the head-to-head judge was right 62.7% of the time, exactly matching the ordinary score on the same 150 fully answered pairs. But it chose whichever thumbnail it saw first 64.7% of the time, and for almost a third of pairs it gave opposite answers depending only on the order. Equal accuracy with far less stability meant it was not adopted. The full results are in our separate write-up on asking an AI to compare thumbnails.
Switching on the model's reasoning mode
The model offers a setting that makes it work through a problem step by step before answering, at several levels of effort. At the three lower levels, a full analysis of a test thumbnail came back with the same twelve ratings as with the setting switched off. Only the highest level changed the model's behaviour at all.
In the European data centre we use, so that uploaded thumbnails are never processed outside the EU, that highest level never returned an answer, across repeated attempts lasting up to three minutes. We confirmed it does work in a US region using a made-up arithmetic question with no thumbnails involved, and found it wrote its reasoning as plain text in front of the answer instead of keeping it separate. Moving uploads to the US to find out whether it helps was not a trade we were willing to make.
The four results side by side
Each change was compared with the original on the same pairs, so every difference below is like for like.
| Change | What it did to ranking accuracy | Kept? |
|---|---|---|
| Compare unrounded scores | 59.5% to 62.0% on 321 pairs, entirely from former ties breaking about evenly | Yes, as a fairer measurement |
| Calibrated scoring instructions | 64.6% to 63.4% on 161 pairs, no detectable difference | No |
| Compare thumbnails head to head | 62.7% against 62.7% on 150 pairs, with answers that depended on order | No |
| Model reasoning mode | No change at the levels that ran; the highest never answered in our region | No |
Every figure here comes from the same scoring pipeline that runs when you analyse a thumbnail and title. The tests scored real videos through the product itself, not through a separate research copy of it.
How we kept these follow-up tests honest
Follow-up experiments are where studies usually go wrong, because the researcher already knows which answer they would like. Five rules kept that in check:
- The published result was never touched. The pre-registered 59.5% stays the headline, and every later analysis is labelled as follow-up work.
- The channels were split in half before any change was tested. The experiments used one half, and the other half was kept aside for a final check.
- Each change was compared with the original on the same pairs, counting only the pairs where the two disagreed, which is far more sensitive than comparing two overall percentages.
- A small pilot was treated as a reason to run a bigger test, never as a result in its own right.
- Every head-to-head comparison was shown in both orders, so a preference for position could not pass for skill.
None of these needs a statistics degree, and most apply directly to a creator testing their own thumbnails: decide what counts as a win before looking, compare like with like, and treat a small early result as a reason to keep testing.
Limits of these follow-up results
All four experiments used the same established, English-language channels as the original test, and one model. The ideas were chosen after the original result was known, which is exactly the situation that tends to flatter a finding, and one more reason the headline stays at the pre-registered figure.
Each change was tried once, in one form. Different wording for the instructions might have done better, and the reasoning-mode result describes what was available in one region in September 2026. None of these results says the score cannot improve; they say that these four routes did not improve it.
Frequently asked questions
Why not report 62.0% as the accuracy?
Because the rules for the test were fixed before any data existed, and they counted ties as failures. Changing a rule after seeing the results is exactly what pre-registration exists to prevent, even when the change is reasonable. The 62.0% is published as a clearly labelled follow-up measurement, next to the 59.5% it does not replace.
Would a smarter AI model make the score more accurate?
Possibly, but that would be a new experiment. The reasoning setting of our current model did not help in the region we use, and a different model would need testing against the same pairs, in the same way, before any claim could be made. Newer does not automatically mean better at this particular task.
Why did a test on 30 thumbnails look so convincing?
Small samples produce large swings by chance, and a large swing looks like a discovery. With 30 thumbnails, two factors appearing to double their spread was within normal variation; at 322 thumbnails the effect almost vanished. It is the same trap as judging a new thumbnail style on two uploads.
What does this mean for testing my own thumbnails?
The same rules apply. Decide what counts as success before you look, compare against your channel's normal range rather than a single previous video, run enough examples that chance cannot explain the result, and if you ask any tool to compare two options, check whether its answer survives swapping them.
Is the score still worth using if these improvements failed?
The score was tested against real outcomes and beat chance by a clear margin. These follow-ups show that four tempting changes did not push it further, which is useful to know rather than a reason to discard it. Treat it as one informed input among several, not as a prediction of views.