
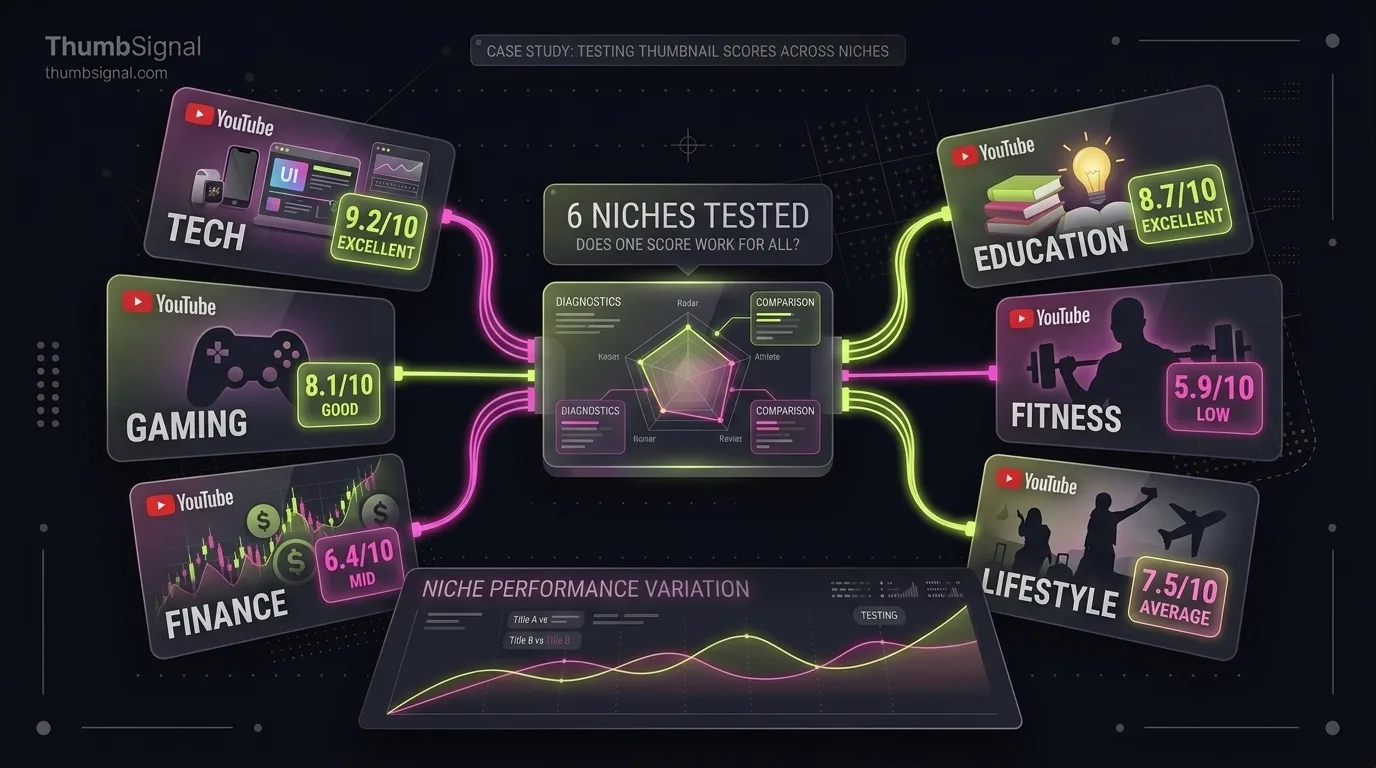
Not equally, and in some niches we cannot yet say whether it works at all. When we tested our thumbnail and title score on 321 pairs of real videos, it ranked the better-performing video first 59.5% of the time overall. Split across six categories, the picture was uneven: lifestyle came out highest, gaming was indistinguishable from a coin flip, and the other four sat in between with too few pairs to call. Here is what each category showed and what it means for your channel.
Key takeaways
- Overall, on 321 pairs of videos from 47 channels, the higher score belonged to the better-performing video 59.5% of the time, against 50% by chance.
- By category, accuracy ranged from 70.5% in lifestyle to 51.6% in gaming. Gaming could not be told from chance.
- Five of the six category results have a 95% interval that includes 50%, so no single category is validated on its own, including the highest one.
- Channels that reuse one thumbnail template for every upload scored at chance, 48.7%, which matters most in niches where templates are common.
- Use the score in your niche as a guide to which version to test, give more weight to large gaps, and confirm with your own channel's results.
Does a thumbnail score work the same in every YouTube niche?
The evidence says it does not, but also that our study is too small to rank niches against each other. Pooled across six categories, the score was right about six times in ten. Inside each category the samples were small, between a few dozen and about 75 pairs, and with samples that size a real 60% and a coin flip can look alike. One category, gaming, gave no sign of working at all.
The question matters because creators rarely work across categories. A cooking channel does not care how the score does on gaming videos. If a tool reports one overall accuracy figure, it is worth asking whether that figure holds where you publish, and whether anyone has measured it there.
How the study was built
The full method is in our write-up of the 321-video test and on the study page. In short, we chose 60 established English-language channels across six categories (tech, education, cooking, gaming, fitness and lifestyle) before scoring anything, and paired two uploads from the same channel published close together. One video in each pair had beaten the channel's own recent baseline and the other had not. The question was simple: does the higher score go to the video that did better?
Why pairs from one channel
Comparing videos from different channels mostly measures channel size: bigger channels get more views and can afford better design, so any score that likes polished thumbnails would look accurate for the wrong reason. Two videos from one channel share the audience, the subscriber count and the design budget. What is left is closer to the packaging itself, with a known chance rate of 50%.
Why the category split is exploratory
The study was designed and sized to answer one question across all pairs. The category breakdown was not its test: it is six extra looks at the same data, with no correction for looking six times, and each look rests on far fewer pairs. We report it because creators ask for it, and we label it as exploratory everywhere it appears.
Results by category
| Category | Pairs | Higher score on the better video | 95% interval | Can it be told from chance? |
|---|---|---|---|---|
| Lifestyle | 44 | 70.5% | 54.8% to 83.2% | Yes, narrowly |
| Cooking | 70 | 61.4% | 49.0% to 72.8% | No |
| Education | 30 | 60.0% | 40.6% to 77.3% | No |
| Tech | 75 | 58.7% | 46.7% to 69.9% | No |
| Fitness | 38 | 57.9% | 40.8% to 73.7% | No |
| Gaming | 64 | 51.6% | 38.7% to 64.2% | No, and close to 50% |
Reading the table honestly
Lifestyle is the only category whose interval stays above 50%, and it is also one of the smallest. With six looks at the data, one of them clearing the bar by a small margin is the kind of result chance produces often, so it is not evidence that the score works best for lifestyle channels. Cooking, education, tech and fitness all land near the pooled figure, which is what you would expect if the score works about equally across them, but their intervals are too wide to confirm it one by one.
Gaming is the result that stands out. With 64 pairs it is one of the larger groups, and its accuracy sits barely above a coin flip. We do not know why. Plausible reasons include recurring series art, characters and game footage that look alike from video to video, and audiences that choose by game or series rather than by the thumbnail. None of these was tested, so treat them as questions rather than findings.
Templates erase the signal, in any niche
A separate control in the same study looked at channels that use one thumbnail template for every upload. On those channels, the score was right 48.7% of the time, which is chance, against 61.0% on all the others. That is the expected result: when two thumbnails are nearly identical by design, a score cannot separate them, and whatever made one video do better lies elsewhere, often in the topic. If your niche runs on templates, expect the same.
How to use a packaging score in your niche
- Compare versions of one video's packaging, not your thumbnail against another channel's. The score was tested on pairs from the same channel.
- Make the versions genuinely different. Two variations of one template give the score nothing to separate.
- Ignore small gaps. Across the study, gaps of 1 to 3 points could not be told from chance, and the model's own answers to an identical request vary by about 3 points.
- In gaming, or any niche where you suspect the score has little to say, use it only to choose which two versions to test, then let real results decide. You can score two versions of your thumbnail and title and see whether the gap is large enough to matter.
- Check results against your own channel's recent uploads, not against a single previous video. Our guide on telling whether a thumbnail test result is real shows how.
What our analyzer says about niches
The analyzer does not know your video's category, and it does not adjust the score by niche: the same reading is applied to every thumbnail. That is why the limits are stated rather than hidden. The score is measured on established English-language channels as a whole; it has not been validated on any single category, on other languages, or on small and new channels, whose thumbnails may differ more than those in the study.
Limits of this breakdown
Each category holds between 30 and 75 pairs, too few to compare categories with each other or to validate any of them alone. All channels were established and English-language. Gaming's result could reflect something about gaming packaging or simply the particular channels in the sample. We would call a category measured only with at least 150 pairs and an interval that stays above 50%, and we plan around 200 for any new segment.
Frequently asked questions
Does a thumbnail analyzer work for gaming channels?
In our study, not measurably. On gaming pairs, the higher score went to the better-performing video 51.6% of the time, which cannot be told from chance. Use a score there only to choose what to test, and rely on your channel's own results.
Which niche does the thumbnail score work best for?
We cannot say. Lifestyle came out highest at 70.5%, but it is one of six small samples and the margin over chance is narrow. The fair reading is that the score works about as well across most categories as it does overall, and that gaming is the exception we cannot explain yet.
Why is my niche not validated if the overall result is positive?
Because an overall result can come from several categories each contributing a little. To validate one niche alone you need enough pairs in that niche for the uncertainty to exclude 50%. Our study had between 30 and 75 per category, which is not enough.
Does the score adjust to my niche?
No. The analyzer applies the same reading to every thumbnail and does not ask for your category. What changes by niche is how much the score has been shown to tell you, which is why we publish the breakdown and its limits.
Do thumbnail templates hurt my score?
They do not lower the score; they make it uninformative. On channels using one template for every upload, the score could not tell the better video from the weaker one. If you use a template, test changes to the parts that vary, such as the main image and the words, and make them large enough to matter.